Decision Referral: Combining strengths of radiologists and AI
Decision referral is at the core of our AI concept. Here we explain what it is, how it works, and the impact it can have on radiologists' metrics when reporting with Vara.
The decision referral concept is explained here in easy and accessible terms for an interested audience. A few relevant details are being skipped for the sake of brevity. More details can be found in our peer-reviewed publication Strategies for integrating artificial intelligence into mammography screening programmes: a retrospective simulation analysis.
Mammography screening
First, let's look at how decisions are made in a typical mammography screening program today. We will use Germany as an example, which closely follows European recommendations. In Germany, roughly 3 million women are screened every year [1]. Each case is reviewed by two radiologists independently (“blinded read”) in the first and second read (“double read”) of the screening. If at least one radiologist assesses the case as suspicious (BI-RADS >= 4), then a “consensus conference” is held. Roughly 12% of cases go to consensus conference (i.e., 360,000 cases each year).
During the consensus conference, a group of radiologists, including the medical lead of the screening unit, decides whether the case should be recalled for further follow-up investigations (e.g., magnifications, ultrasound, or MRI). Approximately 4% of cases are recalled (i.e., the women are invited for follow-up imaging). As recalls are a source of stress for participating women, one goal of the screening system is to avoid unnecessary recalls.
Finally, about 1% of women are biopsied, and cancer is detected in 0.6% of all cases. Taken together, this means that there are 3,000,000 * 0.6% = 18,000 positive cases (cancers) each year, and 3,000,000 * 99,4% = 2,982,000 normal cases (healthy women). 69% of those 18,000 cancer cases are found by only one of the two radiologists (i.e., the other radiologist missed the cancer) [2].
The following diagram shows the number of cases per stage in a blinded double-read screening system (example data from Germany):

Radiologist performance
Let's now look at the performance of the average radiologist at the point of screening and before the consensus conference: The average sensitivity and specificity of a German radiologist is 84.4% and 94.0%, respectively [2]. This means that, on average, a radiologist detects 84.4% of the screen-detected cancers and misses 15.6% — which are then only detected because of the second radiologist. These are the false negatives of the radiologist. Similarily, a radiologist correctly classifies 94.0% of the normal cases as negative, but also deems 6.0% of actually negative cases as positives. These are the false positive cases of the radiologist.
When both radiologists miss a cancer, it will either be found in the next screening round or it will manifest as a so called "interval cancer" (a cancer found in the interval between two screening rounds). Those cases are not part of this evaluation.
Introducing decision referral
The goal of decision referral is to support the radiologist with AI to improve both the sensitivity as well as the specificity (i.e., reduce false negatives and false positives). At the same time, AI is also not perfect and cannot make 100% correct predictions for all cases. Therefore, the goal of decision referral is to combine the human expertise of radiologists with the technical capabilities of AI today.
Decision referral is a screening process in which the algorithm only makes a statement for cases when it is confidently making good predictions — while leaving other cases to human expertise.
Decision referral is built upon three pillars:
-
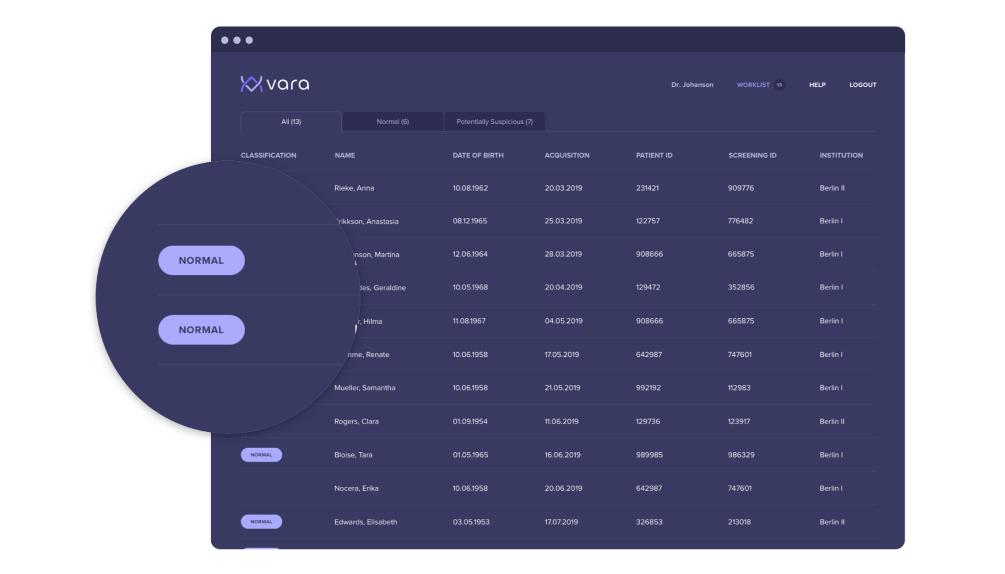
Normal triaging: The algorithm selects a subset of cases that it deems normal with high confidence, and automatically labels those cases for the radiologist. The goal of normal triaging is to label as many cases negative as possible, with minimal misclassification.
Cases that Vara classifies as “normal” are tagged in the worklist in the leftmost column:
-
Safety net: For cases where the AI is very confident that the images are suspicious, it offers a safety net: Should the radiologist classify one of those cases as negative, the safety net triggers and points the radiologist to a specific region in the image that is suspicious to the AI. The radiologist can then reconsider the decision, potentially catching a cancer that would have otherwise been missed.
The safety net localizes where in the image a suspicious lesion is detected: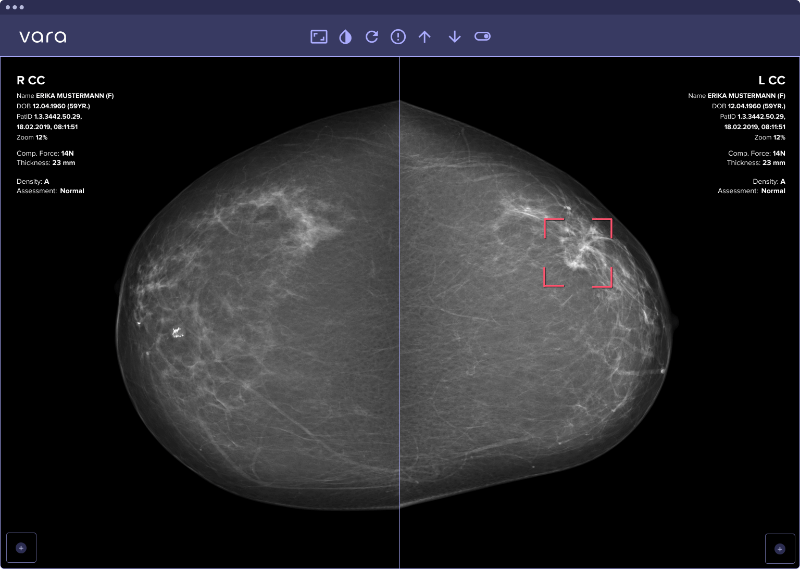
Unclassified cases: Importantly, the AI does not make a statement for all cases. There are cases that are neither classified as normal (the least suspicious cases), nor is the safety net activated (the most suspicious cases). For those cases, the AI is not confident enough and the decision expertise should come from the radiologist.
An intrinsic property of decision referral is its configurability: One can configure the AI so that the lowest 50% of cases are labelled normal, or one can configure it to label the lowest 70% as normal. Similarily, the safety net can be activated for the 1% of most suspicious cases, or alternatively for the 2% of most suspicious cases.
The question is: Which combination of normal triaging and safety net configuration has the most positive impact on the radiologist's metrics?
Let's look at both AI systems in isolation. Normal triaging can only reduce the sensitivity↓ of the radiologist: By labelling a case “normal” that is actually a cancer, the sensitivity of the radiologist decreases. On the other hand, normal triaging can label a case as “normal” that a radiologist otherwise would send to recall unnecessarily. This way, the specificity↑ can go up.
Now, for the safety net, the behaviour is exactly the opposite. Each case that the safety net proposes can only decrease the specificity↓, because it might activate for a case that isn’t actually cancerous. On the other hand, each additional cancer that the safety net catches that a radiologist would have missed otherwise will increase the sensitivity↑.
We will now analyze the following: Is there a configuration for the safety net (specificity↓ and sensitivity↑) and normal triaging (sensitivity↓ and specificity↑) that cancels out the negative effects and results in a net-positive impact on the radiologist's metrics?
Evaluating decision referral
To evaluate this question, we use a large retrospective dataset of the German screening program. For each case, we know the assessment of the two initial radiologists, the recall decision, as well as the final biopsy results (malignant or benign) if a biopsy was done. All positive cases are biopsy-proven and all negative cases have a two year negative followup to make sure they are really negative and not missed cancers.
This rich metadata allows us to evaluate the performance of decision referral retrospectively. We are testing the following scenario: How would the radiologist's metrics change, if they:
Followed the AI’s recommendation for each case where the AI makes a statement, (i.e. a normal assessment for any case that normal triaging labels as "normal" and "suspicious" for any case where the safety net triggers.)
Did their standard assessment for all cases where the AI was not confident enough to make statement.
The table below illustrates on six example cases how these assumptions play out depending on what Vara's AI said and what the radiologist said:
| case | rad. original assessment | Vara assessment | whose assessment to use |
|---|---|---|---|
| 1 | normal | unclassified | Radiologist |
| 2 | suspicious | normal | Vara |
| 3 | suspicious | suspicious | Radiologist & Vara |
| 4 | normal | suspicious | Vara |
| 5 | suspicious | unclassified | Radiologist |
| 6 | normal | suspicious | Vara |
| 7 | normal | normal | Radiologist & Vara |
For each case, Vara's AI either classifies the case as “normal”, “safety net” or leaves the case unclassified. If it's one of the first two, we assume the radiologist followed the AIs recommendation and check how that would change their metrics.
Results
Below, you can test different decision referral configurations by yourself. Per default, the AI is turned off, so the radiologist's metrics aren't changed. Once you start testing out different configurations, you will see the impact decision referral can have. For each configuration, we show the delta to the average radiologist metrics (again, the baseline is at 84.4% sensitivity and 94.0% specificity). We also show how many more cancers radiologists on average would detect in their initial assessment, assuming there are 18,000 screen-detected cancers per year (number of cancers detected in Germany per year, see above). Finally, we show the percentage of normal exams that could automatically be triaged by the algorithm, thereby reducing radiologists' workload.
We also show an ROC curve plot below to illustrate the system's overall performance. An ROC curve is a standard measure to assess AI systems.
[1] https://fachservice.mammo-programm.de/download/evaluationsberichte/Jahresbericht-Evaluation_2018.pdf
[2] Internal data from 10 German screening units.